Case Study 02
From Power BI bottlenecks to a warehouse-first architecture
How an overloaded BI layer was turned into a warehouse-first architecture by moving transformation ownership out of Power BI.
- Warehouse-first
- PostgreSQL
- Power BI
- ETL
- Python
Summary
The visible problem was Power BI: refreshes were slow, memory usage was high and reports were becoming harder to maintain. But Power BI was not the root cause.
The real issue was ownership of transformation logic. The BI layer had slowly absorbed joins, filters, business rules and data shaping responsibilities that should have lived in a controlled analytical layer.
Core idea: the dashboard was the place where the problem appeared, not the place where the system should be fixed.
Context
The reporting layer consumed data directly from multiple operational sources: a document database storing business transactions and a relational database managing workflow state. Power BI connected to those sources, joined records, filtered historical data and calculated business metrics inside the report layer.
The architecture had grown organically. It worked while the volume was small, but over time the visualization tool became the place where the analytical system was being assembled.
Visible Problem
The dashboard refresh depended on a gateway that had to pull a large historical window, join records across different database engines and apply transformations inside Power Query.
- Power Query transformations became memory-intensive.
- Some transformations could not be pushed down to source databases.
- Business logic was duplicated across reports.
- Operational databases were being used as analytical sources.
The symptom looked like a report performance problem. The system issue was deeper: a BI tool had become responsible for too much analytical ownership.
Initial Hypotheses
Hypothesis 01
Gateway limitation. The gateway could have been the bottleneck because it was moving too much historical data through one path.
Hypothesis 02
Power Query load. Transformations that could not be pushed down were consuming memory inside the refresh process.
Hypothesis 03
Source design mismatch. Operational databases were being used as analytical sources without an intermediate model.
Architecture Shift
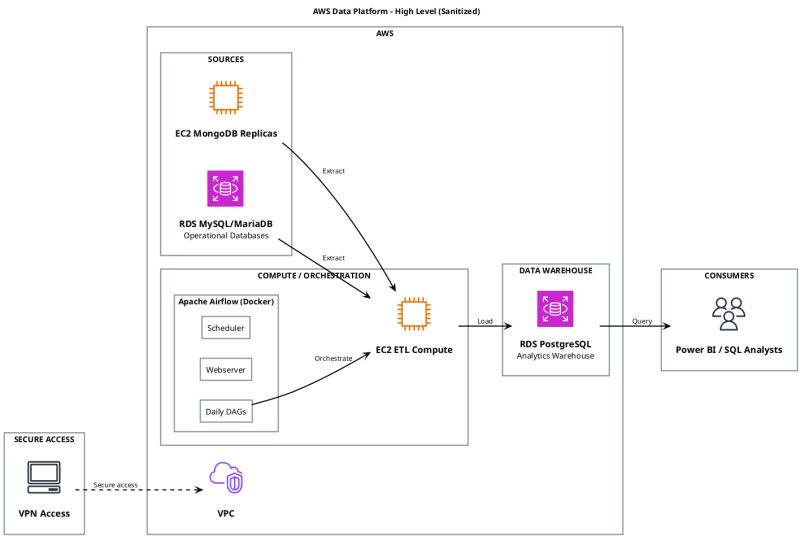
Before
Power BI as transformation layer. Sources were queried directly, business rules were embedded in report files and refreshes depended heavily on the gateway.
After
Warehouse-first flow. Python ETL loaded curated analytical structures into PostgreSQL, and Power BI consumed a clearer model.
Investigation
I traced the flow from source systems to the final report instead of tuning only the visible dashboard. The useful question was not “how do we make this report faster?” but “why is the report responsible for this much work?”.
- Identified transformations happening inside Power Query that belonged upstream.
- Separated extraction filters from presentation filters.
- Looked for duplicated business rules across reports.
- Mapped which parts of the flow were owned by BI files, scripts, databases and people.
Root Cause
The root cause was not one slow query or one bad visual. It was architectural drift. Power BI had become a hybrid of visualization tool, transformation engine and business logic container.
That made performance worse, but it also made ownership unclear. When logic lives inside report files, it becomes harder to test, reuse, review and operate.
Key Decisions
The first improvement was moving date filters earlier in the pipeline. Instead of loading everything and filtering later, the ETL extracted only the relevant window before joining sources.
The second improvement was using idempotent UPSERT loads. If a run failed and retried, the warehouse would converge to the same final state instead of creating duplicate rows.
The third improvement was modeling analytical tables explicitly instead of exposing raw operational structures to Power BI.
What Changed Operationally
Less duplicated logic
Business rules moved into a central analytical layer instead of being copied across report files.
Less gateway dependency
The refresh path became lighter because Power BI consumed curated tables instead of pulling and shaping raw operational data.
More reuse
New reports could use the same warehouse model instead of rebuilding the same joins and metrics.
Clearer ownership
The platform owned transformation logic; Power BI focused on reporting and consumption.
Trade-offs
This added a new layer to maintain: pipelines, migrations, monitoring and documentation. But it removed a worse kind of complexity: hidden business logic inside report files that could not be easily tested, versioned or reused.
Result
- Power BI became lighter and easier to maintain.
- Business logic moved into a central warehouse layer.
- New reports could reuse the same curated model.
- The architecture became easier to reason about and operate.
Lessons Learned
A dashboard can be the most visible part of the system, but that does not mean it should own the system. Reliable reporting usually starts earlier: in data modeling, transformation ownership, operational boundaries and the path the data takes before anyone opens Power BI.